Safety Performance Indicators

Leverage aircraft analytics to make improvements to airline training and safety programs, before incidents occur.

My Role: Lead UI/UX Designer

Client: Boeing’s Safety Data Analytics (SDA) team and airline safety and training focals, responsible for analyzing safety data and improving fleet operations.

Target Users: SDA personnel and airline safety/training managers seeking insights to enhance safety, detect fleet issues proactively, and improve training programs.
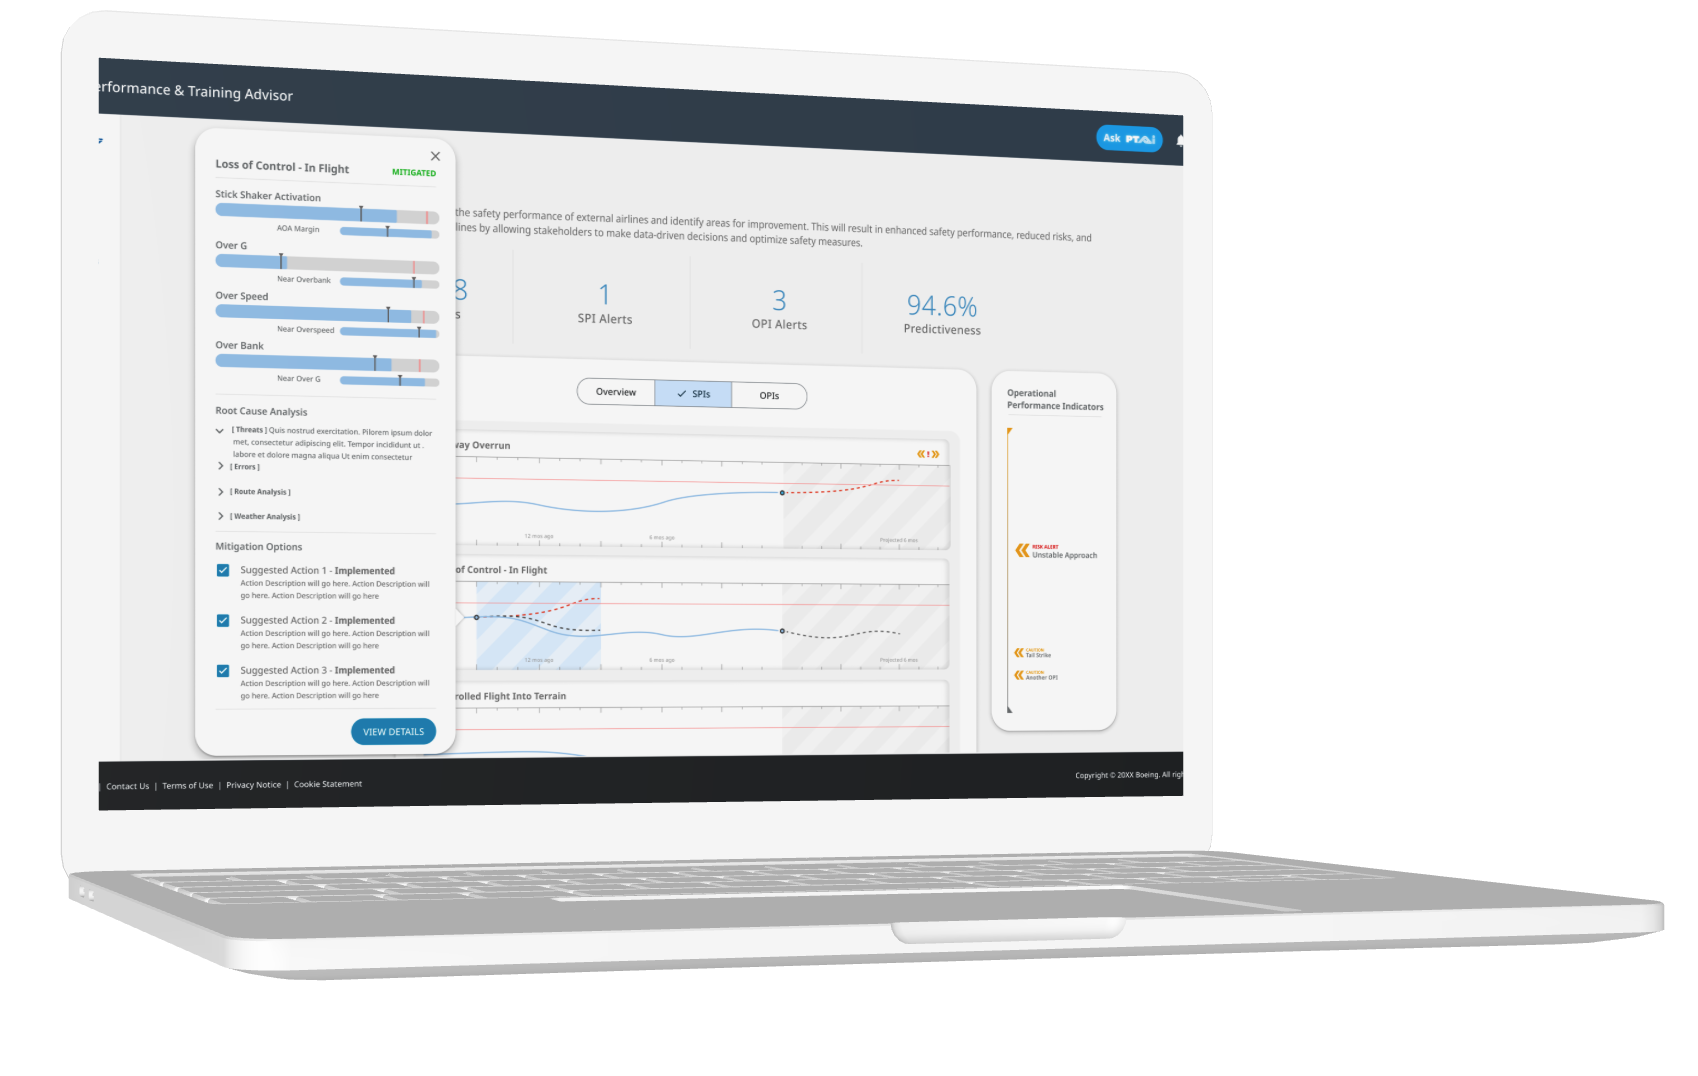
Client’s Goals: Streamline fleet performance evaluation, enable predictive issue detection, and provide tailored insights for Boeing and individual airlines.

Challenges: Aligning data requirements across stakeholders, scoping features iteratively for phased releases, and ensuring usability and clarity for a global audience.

Key Takeaways: Predictive indicators delivered iteratively, enabling Boeing and its partners to improve safety and operations while addressing fleet issues proactively.

The Process

1. Defining the Problem

Achieving consensus among stakeholders, and product team, ensuring clarity in defining the problem statement and establishing requirements.

2. Research

Collaborating with diverse team members to define the problems are users are facing and that aligns with business need to create the best product solutions possible.

3. Ideation

Collaborating with diverse team members to solution for the problems are users are facing and align with business needs

4. Feature List & Dev Collaboration

Determining key application features based on user needs and data source integration complexities.

5. Flows

Mapping out the product and user journeys to get alignment on direction for product.

6. Wireframes & Prototype

Fine-tuning the initial designs into detailed, user-friendly interfaces that align with the product strategy and user feedback.

7. Usability Tests & Functional Specifications

Testing the refined designs and writing technical specifications for ease of use for developers.

8. Iteratively Implement

Designing to scope, and iteratively improving the design to include more features.

Problem Statement

Key Airlines and Boeing safety and training experts often rely on post-incident data for analysis, making them reactive rather than proactive in addressing operational issues. There is a need for tools that identify patterns before incidents occur, enabling adjustments to training programs and reducing operational risks.

1. Defining the Problem

The Safety Data Analytics (SDA) team manually produced a chart called the Health Check Benchmark (HCB), which contained indicators aligned with the European Union Aviation Safety Agency (EASA) regulation standards for airline fleet safety. These charts were distributed to airlines on a one-off basis, highlighting the need for automated and dynamic delivery.

Unclear Requirements: Our team was approached by Boeing’s Chief of Engineering to automate the HCB charts and expand their scope to include predictive analytics. However, the specific stakeholder requirements and expectations for the expanded scope were not clearly defined, necessitating a structured approach to gather clarity.

The “Project Plan”: Utilized a “project plan” template to identify end users, define stakeholder needs, and outline the scope and timeline for delivery.

Collaboration: Worked with the project manager (PM) and product owners (POs) to ensure alignment and a comprehensive understanding of the project goals.

2. Research

User research was conducted with focal points from the Safety Data Analytics (SDA) team, airline heads of training, and fleet safety managers. An interview script was drafted, refined with feedback, and practiced before interviews were conducted with users identified by the project manager. The research revealed critical insights into user needs and challenges.

Key Findings:

1. Analytic Comprehension

  • Peer benchmarks required at least three airlines for anonymity and lacked clear safety implications.
  • Clear labels, legends, and explanations were crucial for usability.
  • Industry benchmarks were complex with many influencing variables.

2. Root Cause Analysis of SPI Indicators

  • Additional metrics like flap settings and flight angles were necessary for deeper analysis.
  • Contextual data, such as SOPs, weather, and runway conditions, was critical.
  • Limited SOP availability hindered identification of procedural issues.
  • Machine learning was needed to correlate outcomes with decision-making and problem-solving.

3. Mitigation Planning from Root Cause Analysis

  • Root causes needed to be linked to pilot behaviors, competencies, and tasks.
  • Adoption of Boeing’s CBTA program by airlines was a challenge.

4. Monitoring Impact

  • Post-recommendation trends required baseline data for setting thresholds.
  • Communication with airlines ensured proper implementation of mitigation plans.
  • Tracking operational changes like pilot turnover assessed broader impacts.

3. Ideation

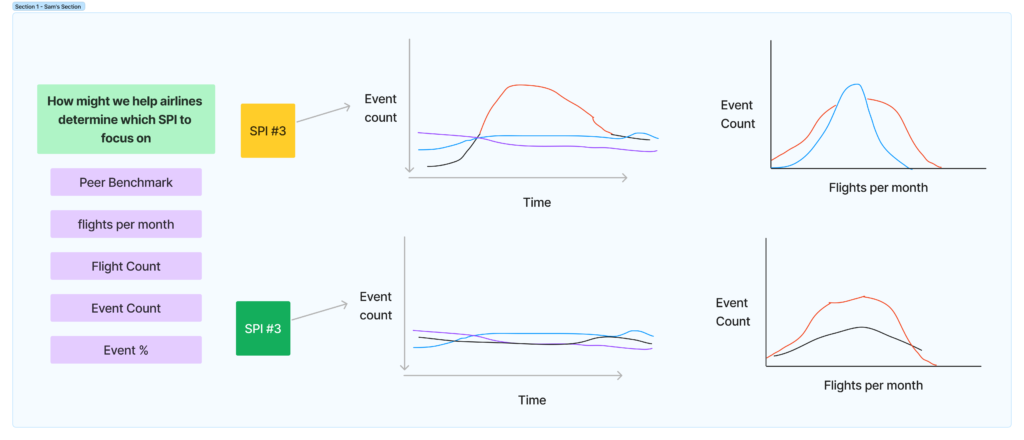
Following the user research report-out, a series of team ideation sessions were conducted to generate solutions for the identified challenges. These sessions centered around “How might we” questions designed to address key problem areas. Using FigJam as a collaborative tool, team members, including engineers, the PM, PO, and Scrum Master, participated in brainstorming activities. Ideas were visualized through sketches and notes, which were later refined in Figma to align with project goals.

4. Feature List & Dev Collaboration

After the ideation sessions, a feature list workshop was conducted to refine and prioritize potential solutions. The PO led the feature list writing process, with high-level features identified by myself guiding the discussion. Developers assessed the complexity of each feature, which informed decisions on its placement within the release roadmap. This collaborative workshop ensured that the proposed features balanced user needs with technical feasibility, aligning the project scope with achievable timelines.

5. Flows

To facilitate the scoping process and ensure alignment on the project’s features, I created detailed feature flows. These flows outlined the functionality and user interactions for each proposed feature, helping to clarify what would be included in the release. By presenting these flows to the team, I ensured that everyone involved—developers, the PM, PO, and other stakeholders—had a shared understanding of the scope and what I would be designing. This approach streamlined decision-making and kept the project on track.

6. Hi-Fi Wireframes and Prototyping

After the feature list and scoping workshop, I was assigned stories within scope and began designing the product iteratively. Each iteration refined the solution to ensure it was simple, intuitive, and met user needs, delivering a clear and functional final design.

7. Usability Testing

To validate assumptions and refine the design, I conducted usability testing by first creating a detailed test script focused on key assumptions. Collaborating with the PO, we scheduled sessions with users, recording their feedback and documenting insights in an assumption tracker. This process highlighted areas where the design lacked clarity, leading to further ideation sessions and updates to ensure the product met user needs effectively.

Refinement and Functional Specifications

Following updates to the design, such as renaming pages to better align with industry standards, I wrote detailed functional specifications within the Figma design. These specifications outlined any elements not visually represented, providing clear guidance for developers. To ensure alignment, I conducted a developer handoff meeting, reviewing the designs and walking through the functional specifications to prepare for the MVP release. This process ensured clarity and consistency in the implementation phase.

8. Iteratively Implement

After completing the MVP design, usability testing, and developer handoff, I began working on designs for the R1 and R2 releases, focusing on integrating AI-driven features. These enhancements included an AI-assisted chatbot with helpful prompts to help users better understand their data. Additional features provided predictive analytics, automated training recommendations based on data insights, and AI-generated summaries of key trends and patterns in the data.